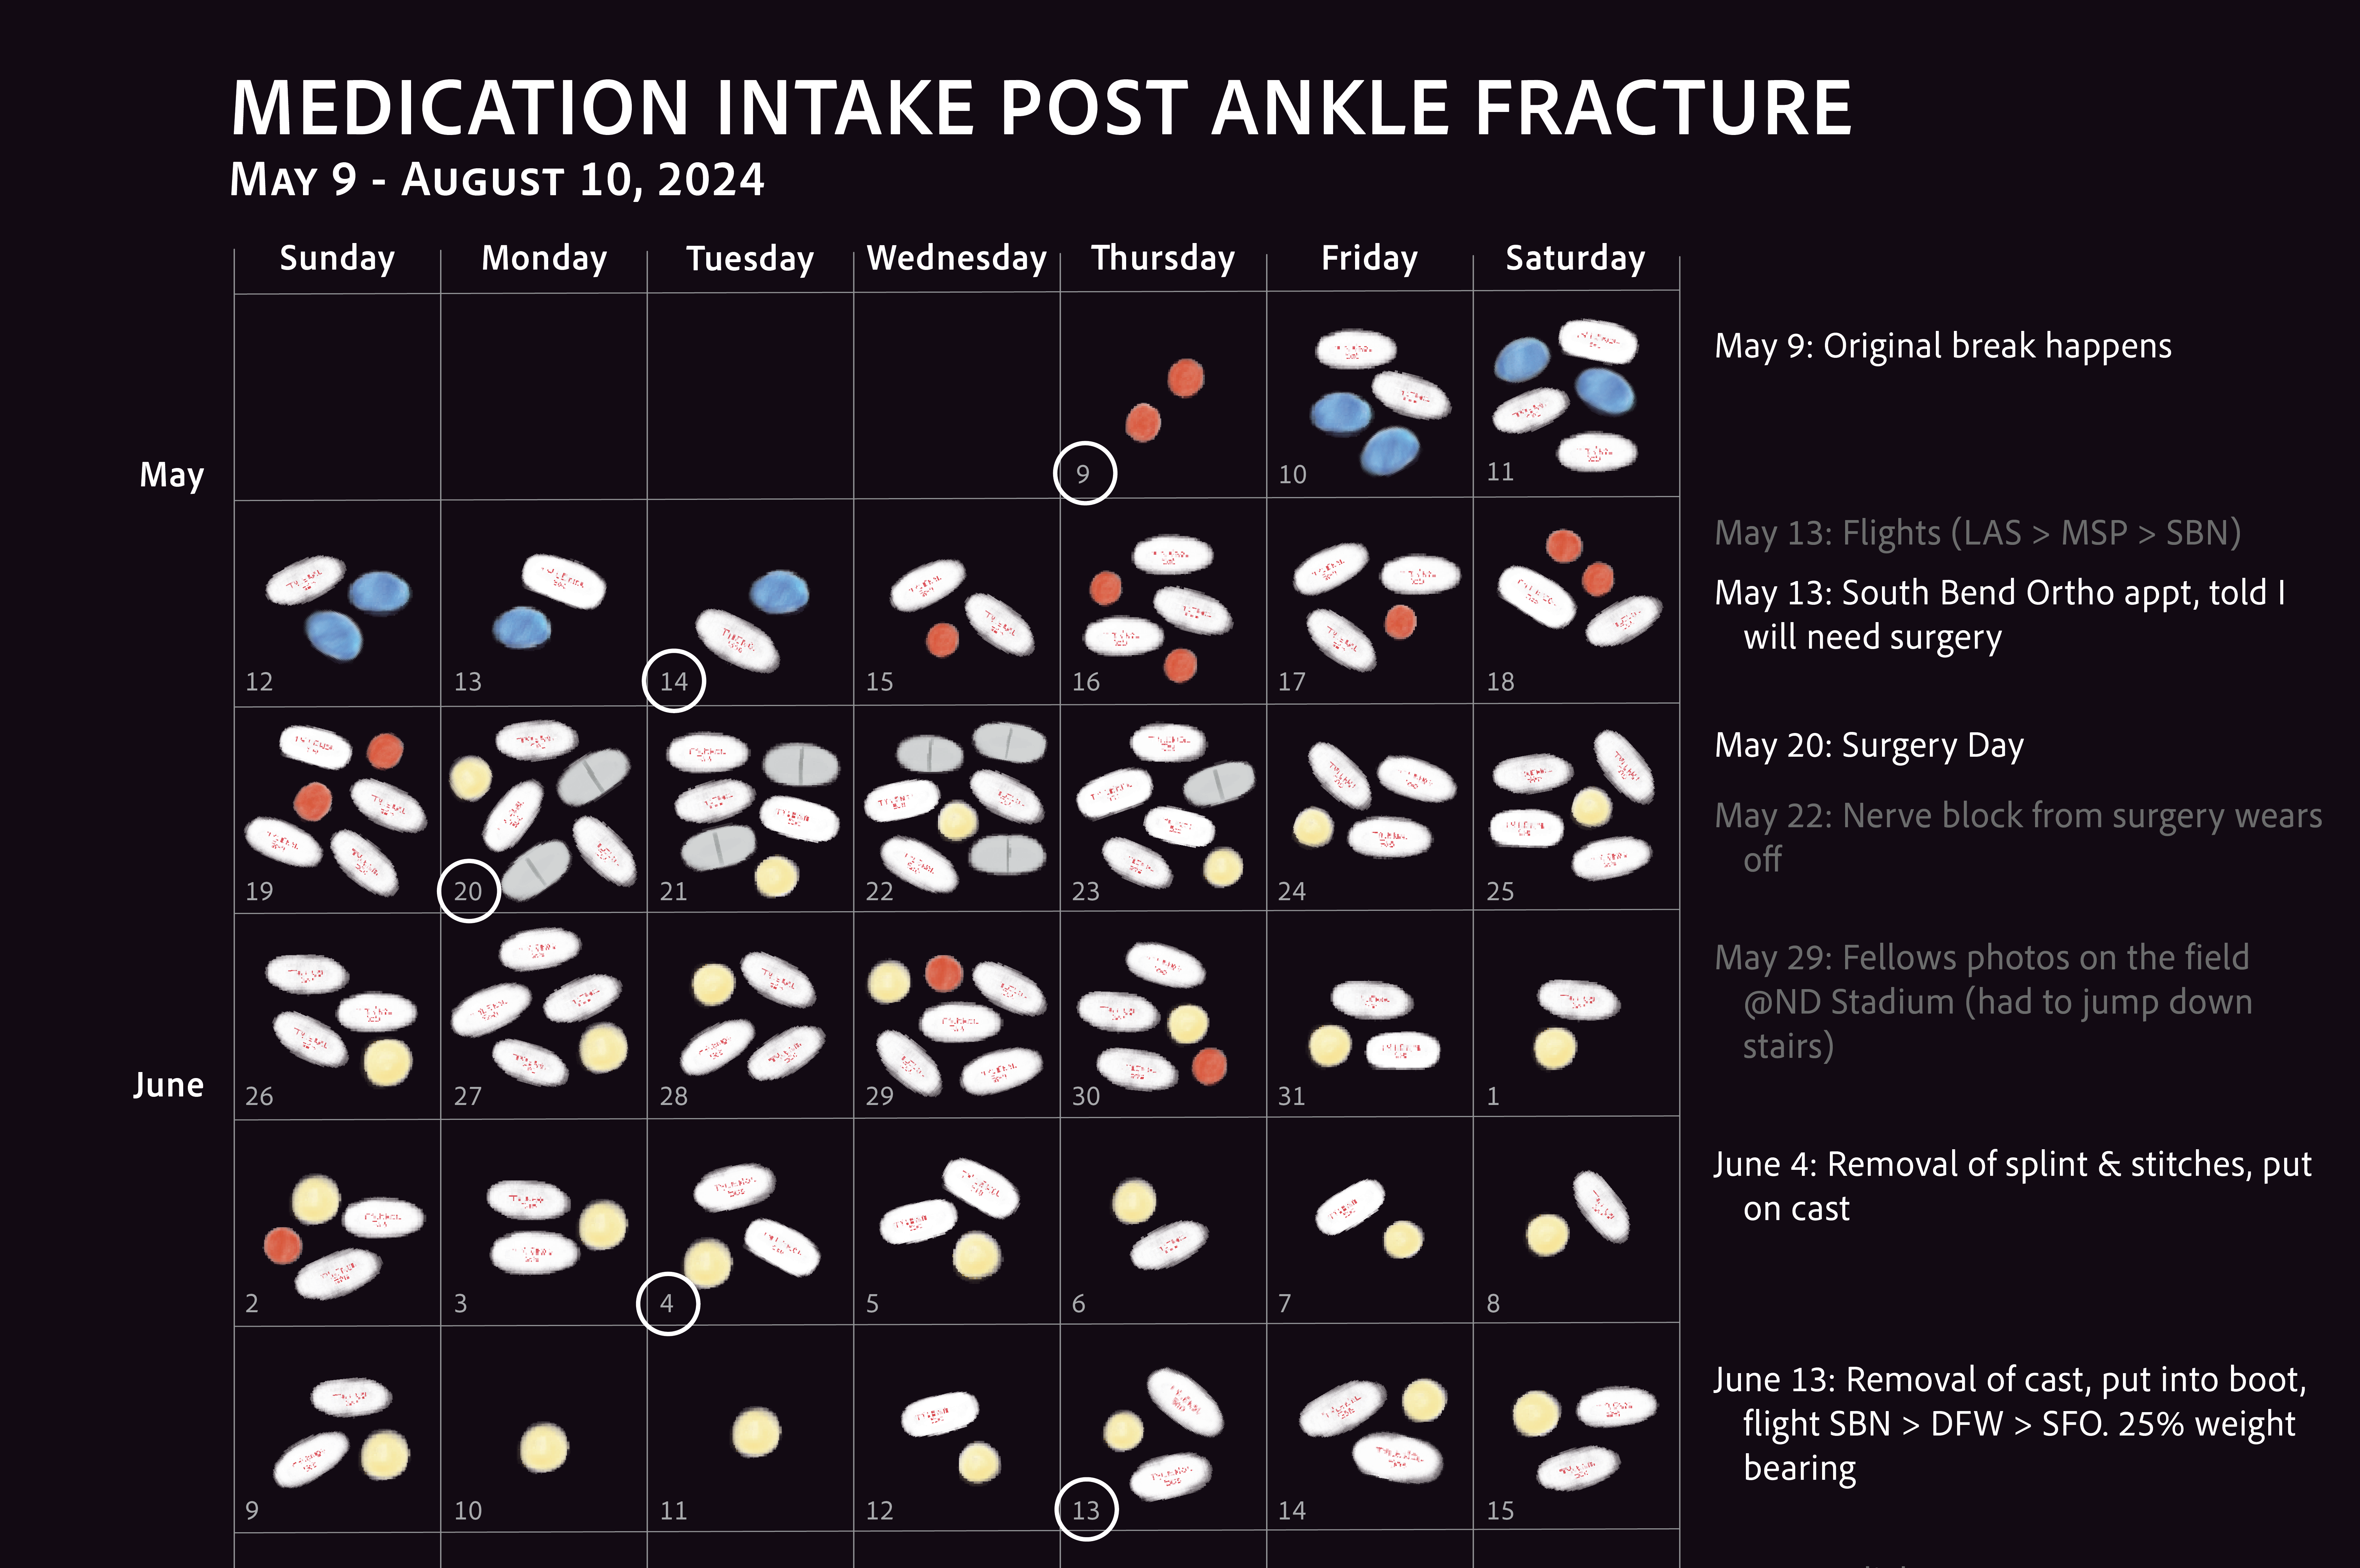
Chart tracking pain medication use following an ankle fracture and surgery, visualized day by day over a three-month recovery.
A data storytelling project exploring how romance novels have changed from 2009 to 2024.
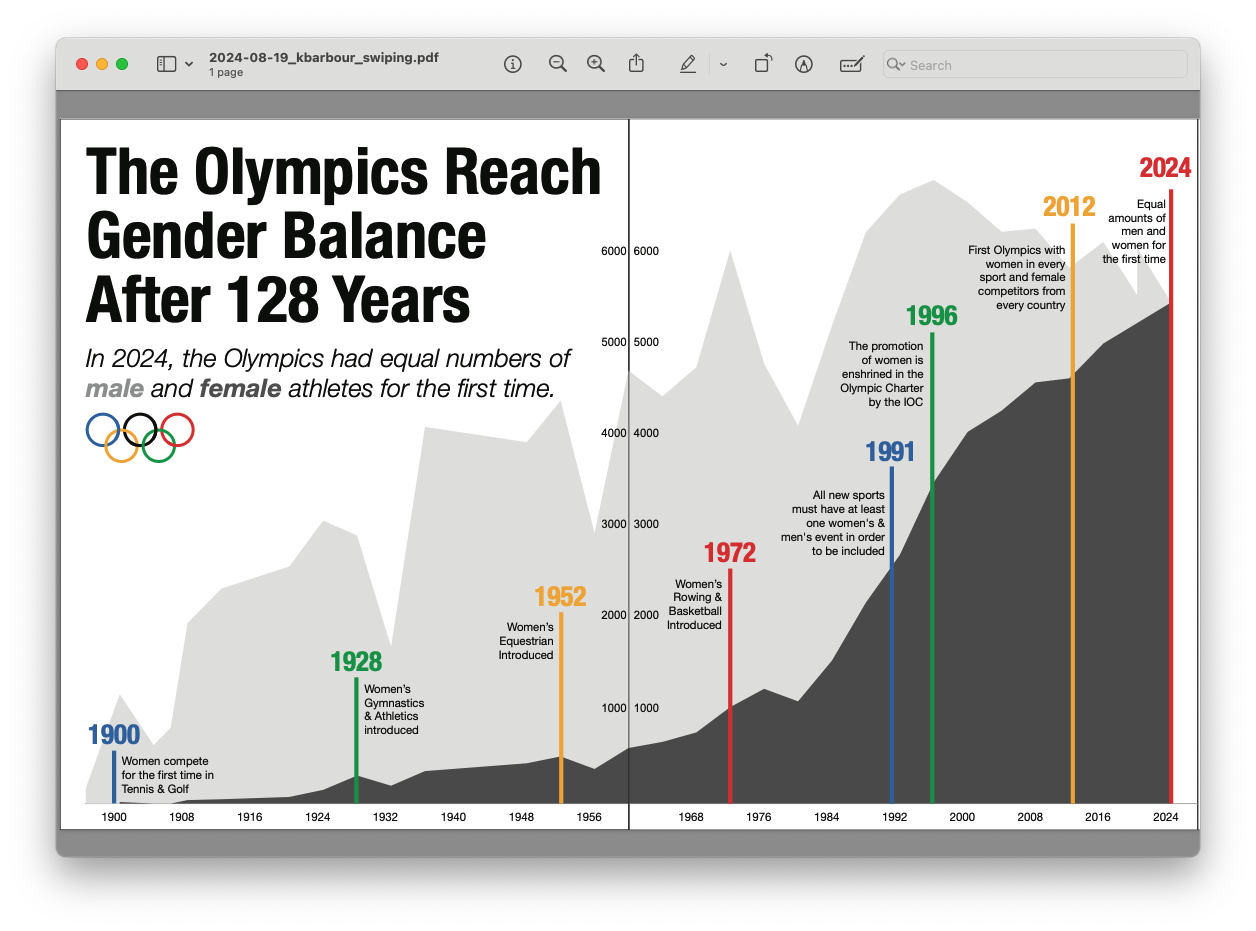
Visualization of the growing presence of women in the Olympics, highlighting milestones and gender parity at the 2024 Games.