Midwest Climate Change
Tracking the Midwest's Rising Temperatures
Interactive site exploring how climate change is affecting the Midwest, with a focus on rising temperatures and heatwaves
Project Overview
This interactive site explores how climate change is already affecting the Midwest — through rising temperatures, longer heatwaves, and increasing health risks. Built in R Markdown with data from the World Resources Institute, it shows how a global crisis is playing out in local, everyday ways.
The Question
How do you convince Midwesterners — especially those who don’t see themselves in national climate coverage — that climate change is already impacting them? This project uses personal context and localized data to make the case.
Audience & Format
Designed for skeptical or unsure Midwestern adults, the project centers on 11 cities across the region. Key metrics include:
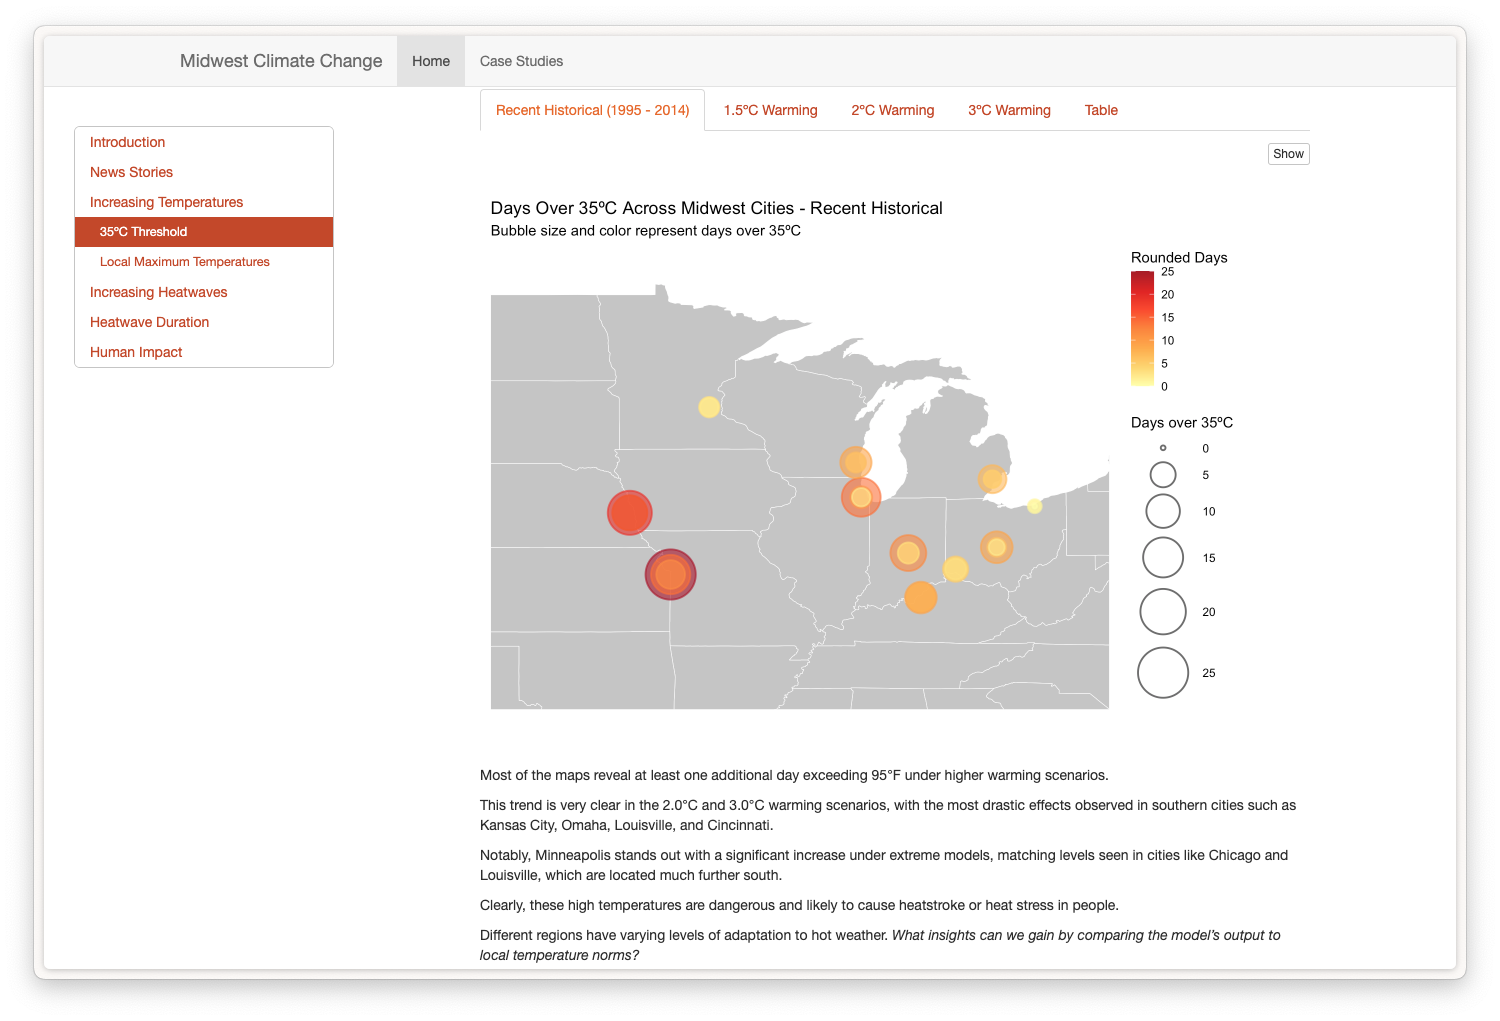
- Days above 95°F
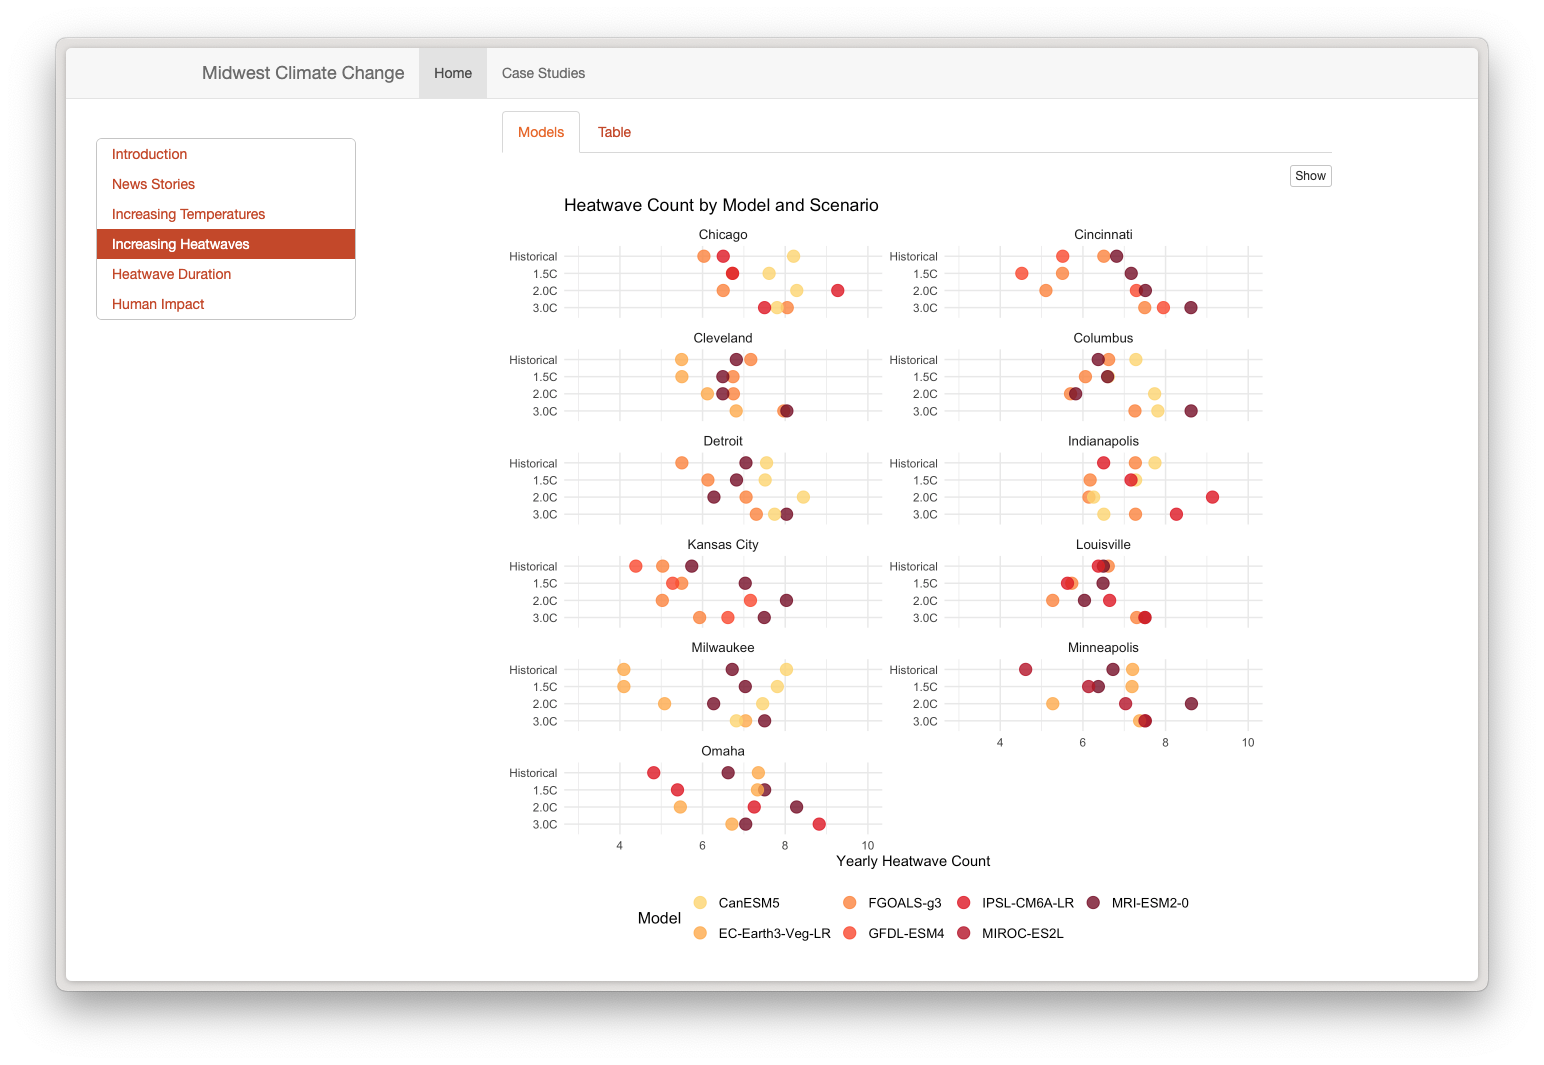
- Heatwave duration and frequency
- Wet bulb temperatures
- Drought risk
Charts are paired with news stories and calendar-style visuals to ground abstract data in lived experience.
Key Insights
- All cities are projected to see more extreme heat, with some expected to double their number of very hot days
- Heatwaves are becoming more frequent and longer-lasting
- Health risks — especially for older adults — are already visible in local ER data
Reflection
This project reinforced that data storytelling works best when it’s grounded in what people know and feel. I’d love to expand it with interactive tools, add equity-focused layers, and improve the design to better connect with everyday users.